Viewing Metrics
Seed pulls together CloudWatch Metrics to give you an overview of your Lambda and API metrics. This includes the number of requests, number of errors, and latency of your Lambda function or API endpoint over time. Viewing these metrics gives you a view of how your Serverless app is performing and you can use it to debug specific issues.
A couple of quick notes about the metrics viewer in Seed:
- Seed internally uses CloudWatch Metrics for this.
- This means that you get unlimited data retention!
- However, AWS will charge you small amount based on your region. It’s roughly $0.01 per 1,000 metrics queried. Make sure to check the CloudWatch Metrics pricing for your region.
- We also need a couple of additional permissions to connect to CloudWatch in your account. More on this below.
Lambda Metrics
To view the Lambda metrics for a stage, simply select the stage.

Click View Resources for the service you are looking for and navigate to the Metrics for the Lambda function.

Or type in the name of the Lambda function you are looking for in the search.

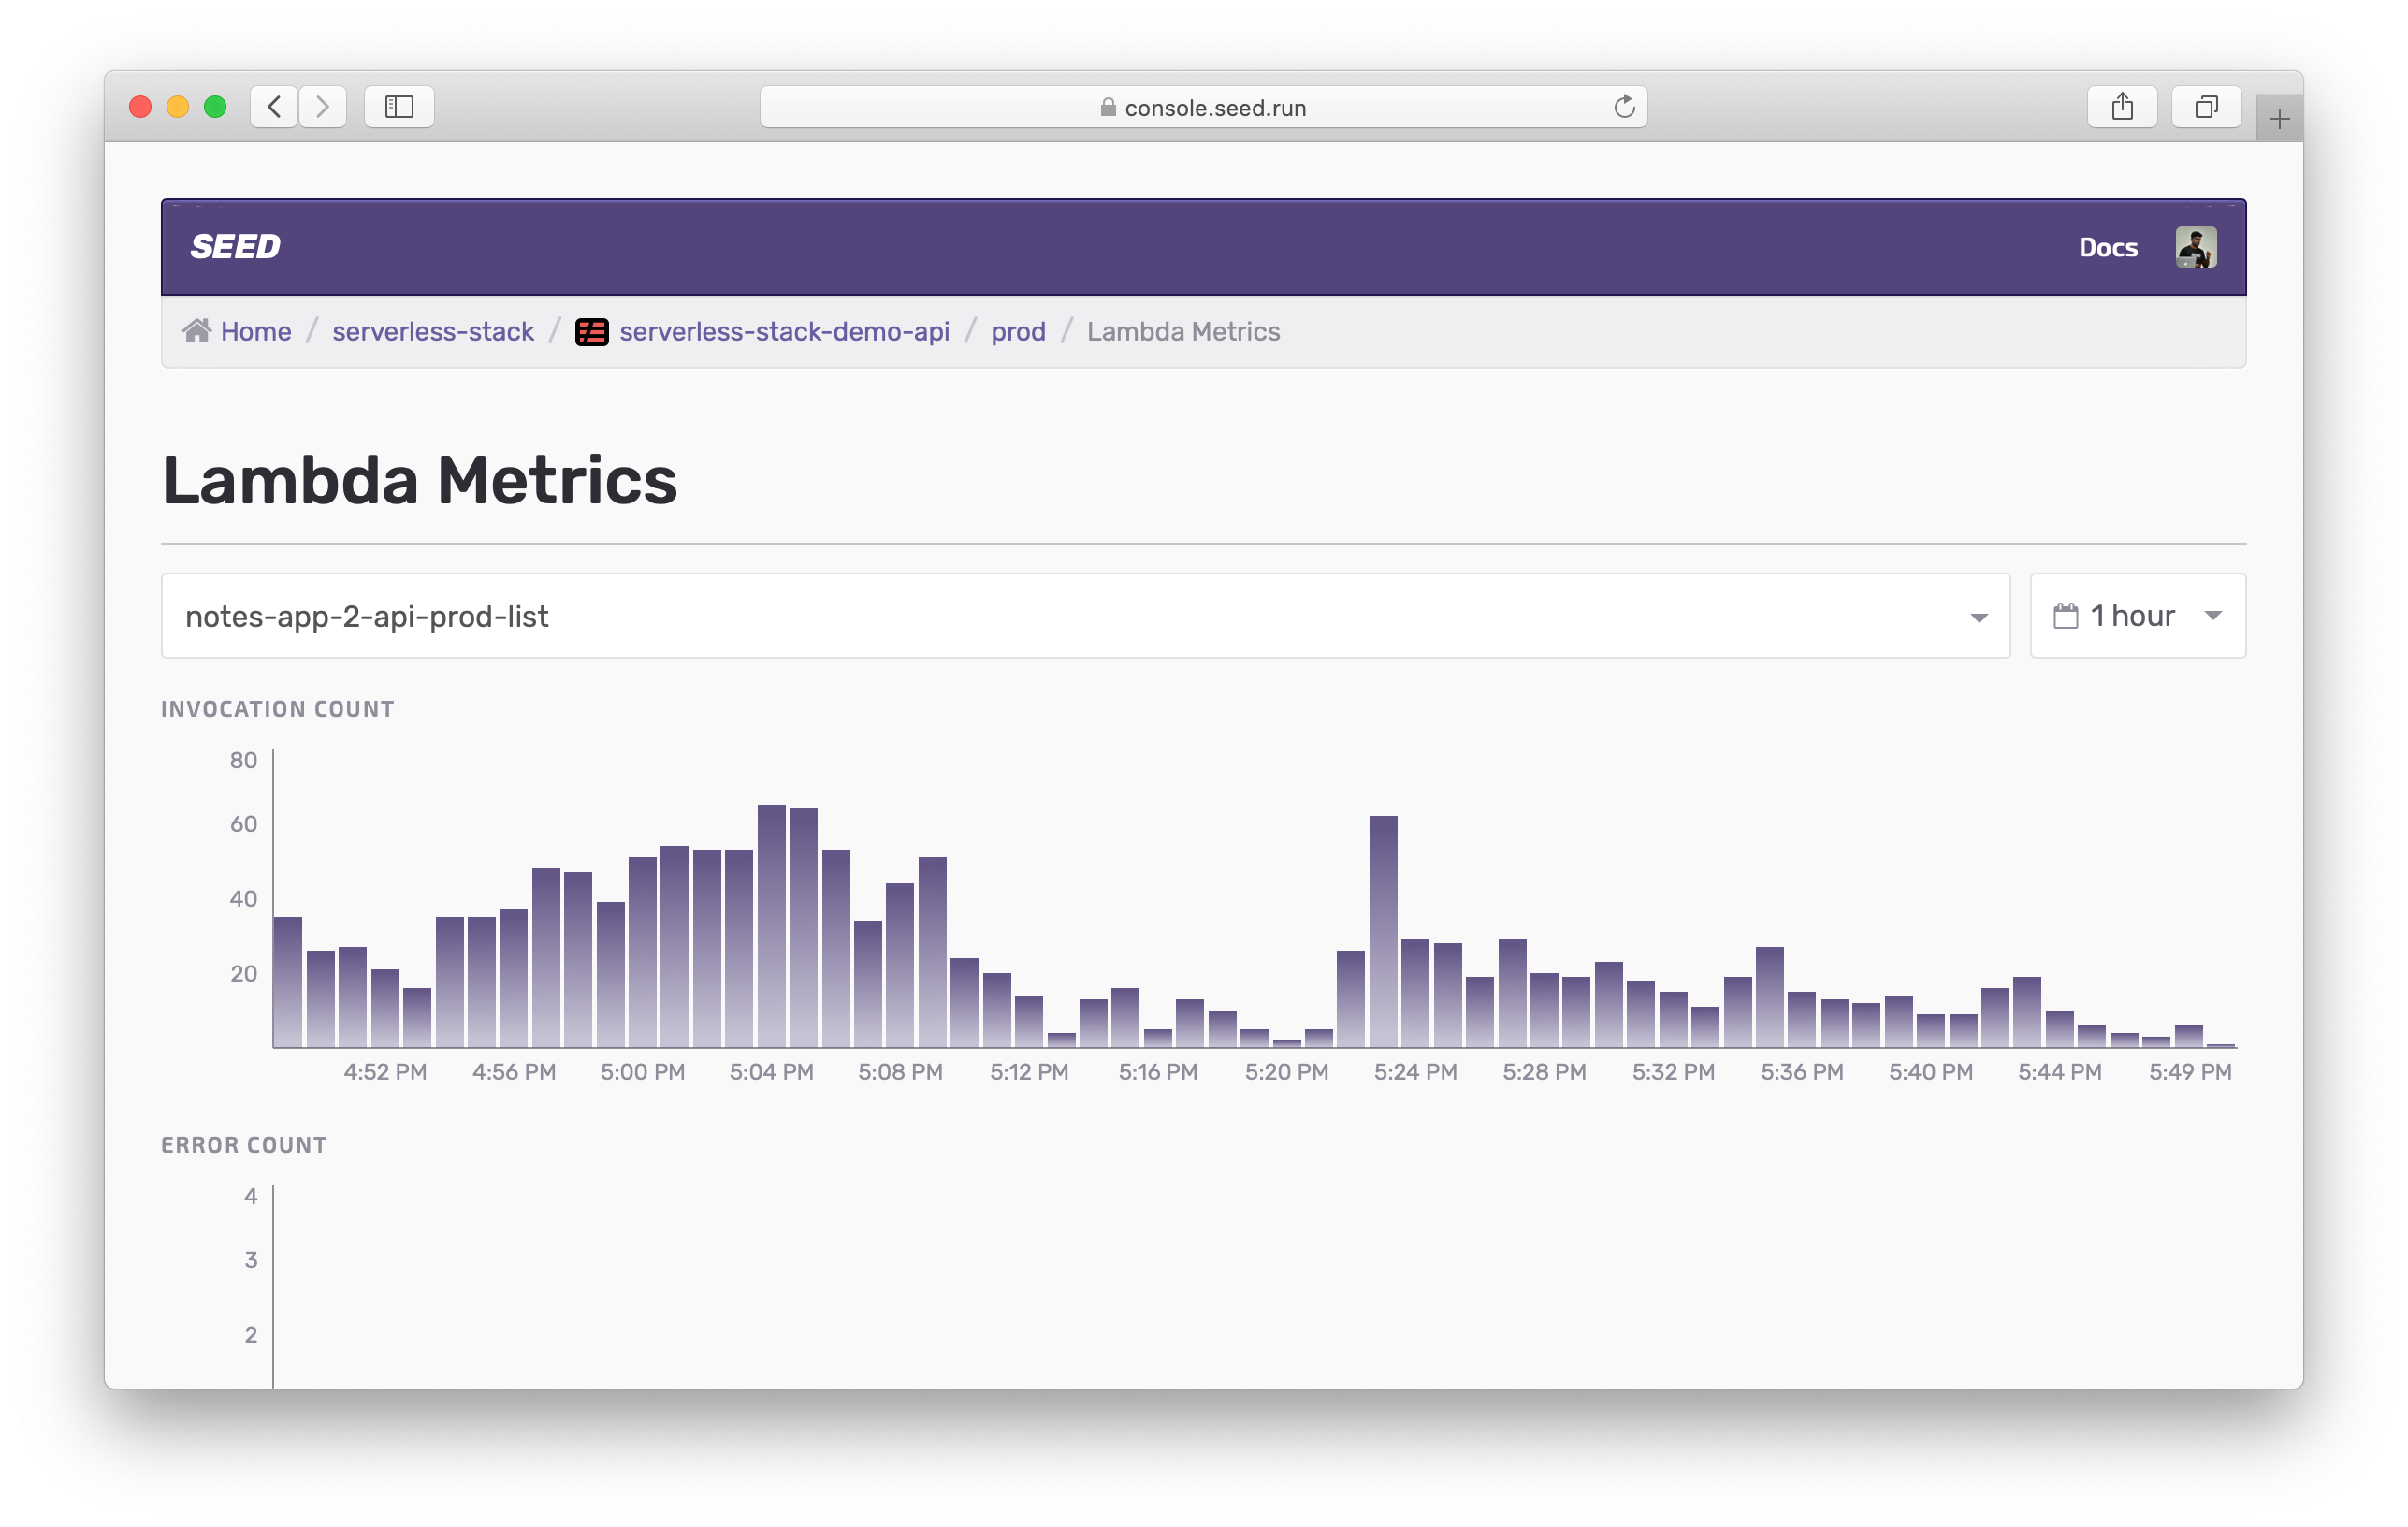
This gives you a live look at the last 1 hour of metrics.
You can easily view the metrics for a different period of time. The time field can take a specific time, range, timestamp, or even a different timezone.

For Lambda, Seed shows you the following metrics:
-
Invocation Count
This is the number of times the Lambda has been invoked.
-
Error Count
This is the number of times the Lambda generated an error.
-
Duration
This is the average, P90, P95, and P99 time (in ms) it took to execute the Lambda.
API Gateway Metrics
To view the API Gateway metrics for a stage, click on Metrics for the API endpoint. Or you can use the search field just as above.
Similar to the Lambda metrics, you get a live view of the last hour of metrics.
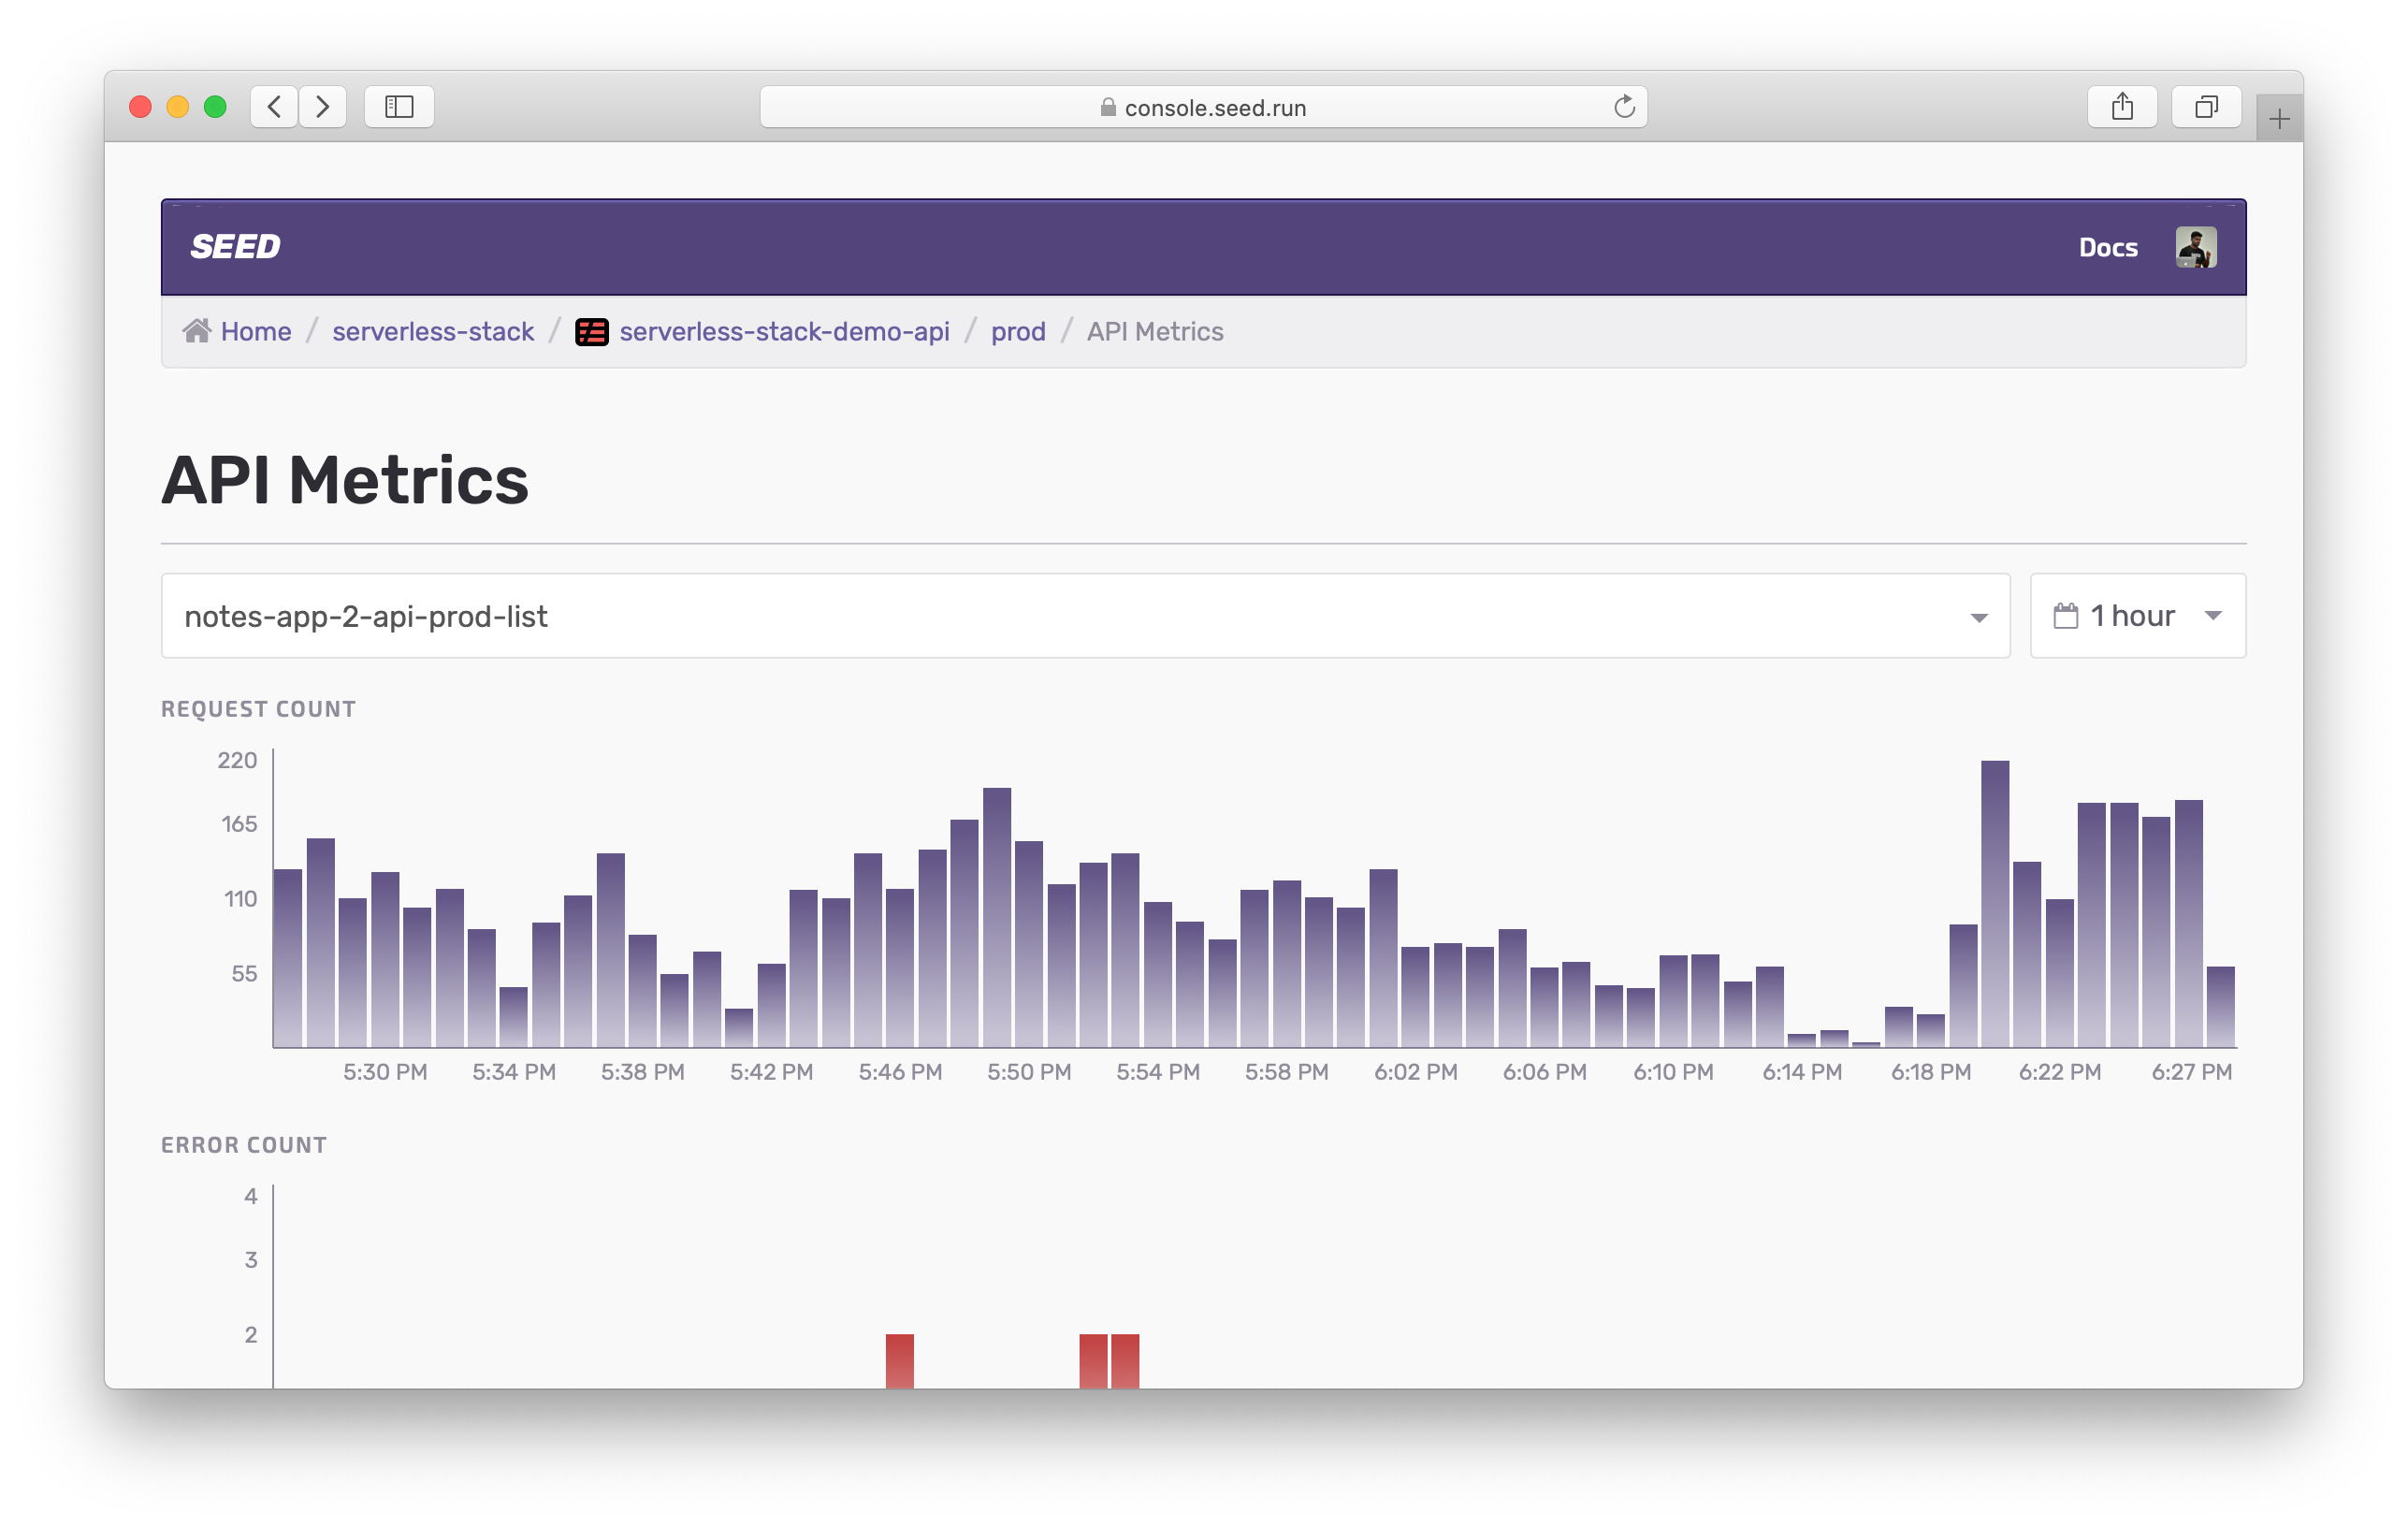
You can view the following API metrics here:
-
Request Count
This is the number of requests made to API Gateway.
-
Error Count
This is the number of times the API endpoint responded with a 4xx or 5xx error.
-
Latency
This is the average, P90, P95, and P99 time (in ms) it took to respond to a request.
Inspecting Logs
You can click on a data point on any of the above graphs to inspect it in detail. This is especially useful in debugging errors.

Clicking through brings up the logs from that period of time. And in the case of errors, Seed will display just the errors.

Note that for Lambda functions, the errors logged in the metrics points to errors that take place outside the handler function. Errors like:
- Out of memory
- Time out
- Errors before initialization
- Before handler
- Syntax errors
- Handler file/function not found
So inspecting the metrics for errors helps track issues that would otherwise not be reported through services like Sentry.
A couple of caveats:
- Errors related to IAM permissions might show up in the metrics but not in the logs.
- Also, we are not displaying any Lambda throttling errors in the metrics.
- Inspecting the Lambda errors is currently supported for the Node.js and Python runtimes.
Additional IAM Permissions
To connect to CloudWatch in your AWS account, Seed needs the following set of additional permissions.
{
  "PolicyName": "MonitorMetrics",
  "PolicyDocument": {
    "Version": "2012-10-17",
    "Statement": [
      {
        "Effect": "Allow",
        "Action": [
          "apigateway:GET",
          "cloudwatch:GetMetricData"
        ],
        "Resource": "*"
      }
    ]
  }
}
The metrics viewer in Seed is designed to work with your development workflow by helping you quickly debug any issues with your deployed apps.
Help improve this page. Edit it with GitHub
Was this page helpful? Let us know via Twitter
Having trouble configuring a CI/CD pipeline for your Serverless apps? Let Seed do it for you!
Learn More